Persona Template Areas
The Persona Template is divided into 12 areas, each is designed to articulate a subset of the persona demographics in a way that we can quickly capture these and we can articulate them using a shared language.
The areas can be grouped into 3 main themes:
- Summary of the persona, how we describe and identify the persona;
- Profile of how they think, what actions/outcomes do they normally achieve, who are the targeted users and what type of work do they do;
- Profile of usage, how often they use the information or features, what level of complexity they prefer, what type of content, device, and data they prefer.
Areas can be filled out in any order. There is a typical flow we use when filling out the Persona Template so we will use that flow to explain each area and we will use the Internal Consumer person example.
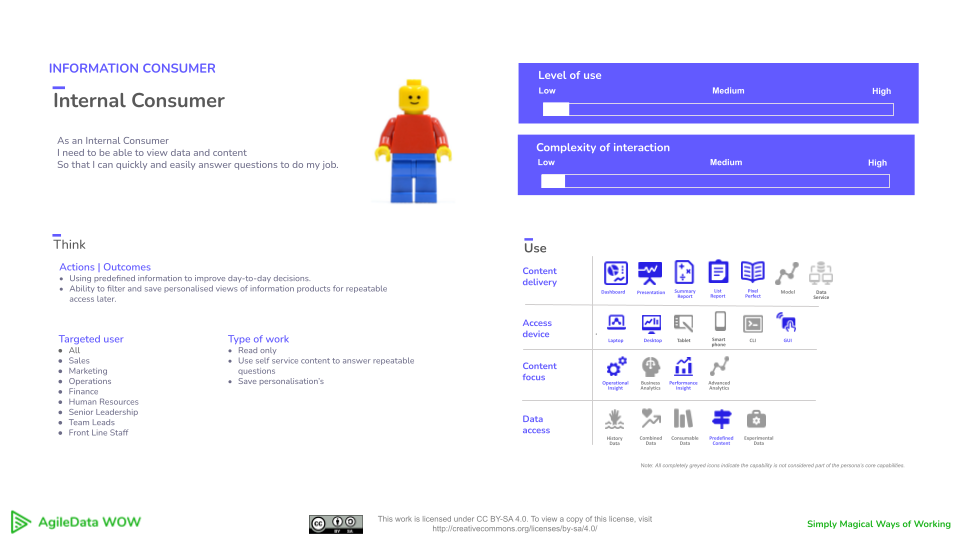
Feel free to experiment with your own flow to find a process that fits your preferred way of working.
01 – Give it a name

Persona Name
The purpose of the Persona Template is to provide a way to describe a unique group of people and give that group a unique name
This will typically be used to identify the persona when talking with stakeholders and the AgileData teams about it, or when we use it as part of other AgileData patterns for example in the Information Product Canvas.
Try to keep the name short but descriptive and relevant to the data domain.
In the product domain, personas often use example names of actual people, for example “”Samantha” – A young professional who is always on-the-go and prioritises convenience and efficiency in her purchasing decisions.” Or they use names based on the demographic group they belong to, for example “Young Urban Professional” – A 25-35 year old, college-educated individual living in a city, with a median income of $50,000-$75,000, who prioritises convenience and efficiency in their purchasing decisions.
For the AgileData Personas we recommend using a name that is familiar in the data domain. We often use names that relate to a traditional data role or their part of the Data Value Stream, For example Information Consumer, Data Analyst, Information Creator, Data Engineer or Data Scientist.
Often you will need to use prefix for the person names to enable you to group people at a finer level of detail.
A common example is the Public Consumer vs External Information Consumer, vs Internal Information Consumer. This allows us to define differences between the three slightly different Personas. We could identify Public Consumers as people who are outside our organisation and who can access Information without having to authenticate themselves as a user / signing in. Compared to an External Information Consumer, who may be a person in a partner organisation. The External Information Consumer is still outside our organisation but we require them to sign-in / authenticate themselves before they can access the information. Whereas the Internal Information Consumer is inside our organisation and may utilise single sign-on to authenticate. These slight variations in behaviour are often enough to create prefix personas.
You will find you hit shades of grey pretty quickly. One example is when you have roles that are dedicated to creating Content (dashboards, reports etc) and other roles that are dedicated to analysing data and providing insights. You might have a persona of Information Creator (or Report Developer) and Data Analyst. But then the Data Analysts have access to the same self service dashboarding tool as the Information Creators, and often create and share dashboards with others, so are they really that different?
We see the majority of the prefix personas in the Information Consumer Data Vakue Chain category.
The key is making sure there is enough difference in the demographics and/or behaviours of people grouped in one persona compared to another persona to help with conversations across the AgileData teams, stakeholders and consumers. If people start arguing that two personas are the same group of people then that value is missing and so think about combining them.
Don’t start off with prefix personas at the beginning, start to introduce them when that level of detail is valuable.
02 – Summarise what they need

Persona User Story
We need a summary of the key thing the persona needs to achieve within the data domain.
Using the agile user story pattern to provide a summary of the persona is useful for people who want to quickly compare them.
The agile user summary typically follows this structure:
As a [persona], I need to [data tasks], so that [reason].
An example we might see:
As a Data Analyst
I need to perform ad hoc data analysis
So that I can uncover new insights.
compared to:
As a Data Engineer
I need to automate the collection and transformation of data
So that other persona’s can leverage it with minimal effort
From this we can quickly tell we are differentiating the personas based on ad-hoc data analysis vs automating the delivery of data.
03 – Provide a visual differentiator
Avatar or Image
We find using an image or icon helps visually differentiate the different persona groups.
Using an image also helps to increase the chances that the team will remember the persona and refer to it regularly, which is important for keeping the persona’s needs and goals top-of-mind.
Avatars or icons also help identify prefix personas which operate in the same Data Value Chain stage, for example all the prefix personas who primarily consume information.
Whether to use images of actual people or avatars or icons for the Persona’s is contentious in the product domain. We use avatars or icons and are great fans of using Lego characters.
Be careful to align the images you use with the culture of your organisation. We have provided generic images in the Persona Template if you need them.
04 – Identify where they work in the Data Value Stream

Data Value Stream Category
We need to understand where in the Data Value Stream the persona operates.
We can use the different stages in the Data Value Stream to categorise the personas and identify differences in where the personas normally operate.
<<<link to pattern to define Data Value Stream>>>
Typical examples of stages in the Data Value Stream are:
- Information Consumers
- Insight Creators
- Data Management
These are macro level stages in the Data Value Stream, not the detailed data tasks to be done, we are using them to categorise and group the personas.
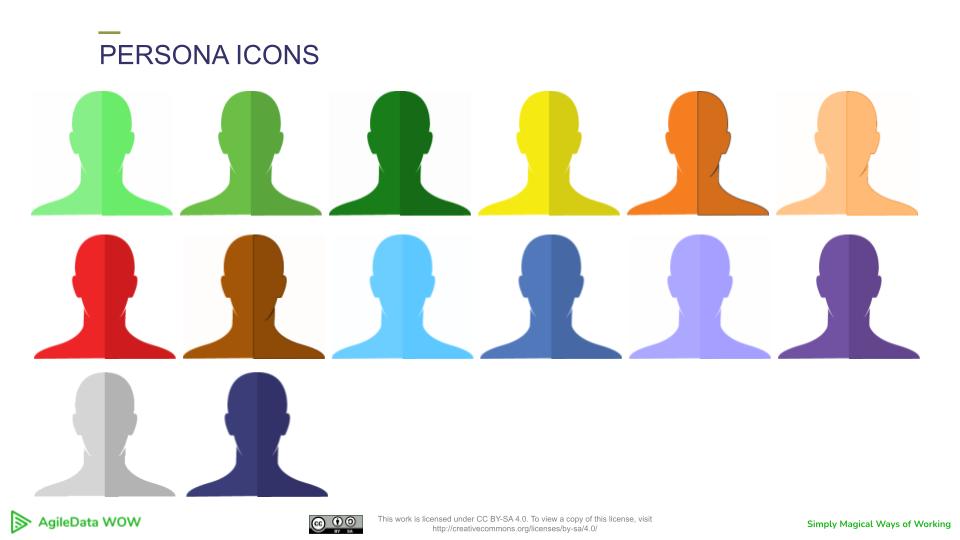
Colour coding the different categories helps identify the different personas which operate in the same Data Value Chain stage or in a different stage.
Visually tying the colour of the Data Value Stream stage with the rest of the persona template also helps to quickly differentiate the personas.

05 – What level of use and complexity do they prefer
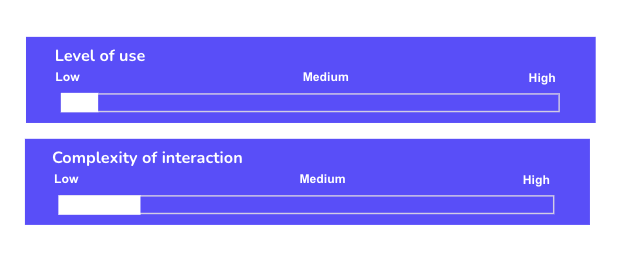
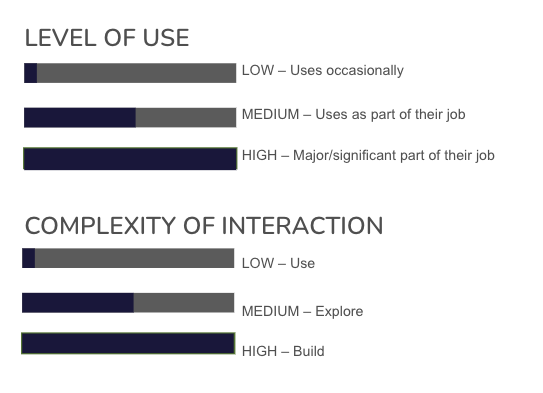
We can use the level of use and complexity of interactions as a way of differentiating between the different personas. We use a simple single bar chart and a simple scale of low to high to do this quickly and provide a way of visually comparing across personas to easily see any differences.
Level of Use
We can use their level of data or tool usage to ensure we deliver the right interfaces to them.
People who use data, information and data platforms every day expect a different set of experiences to those that only use them occasionally.
An Information Consumer persona who is at the organisation’s front line wants to access the information they need when needed, to drive the next action and outcome and then get back to their primary tasks.
Compare this to a Data Analyst persona who will often use data multiple times every day. And then. Compare both of those to a Data Engineer persona who will spend their whole day working with data.
Complexity of Interaction
We can use whether they prefer simple or complex user interfaces to ensure we deliver the right interfaces to them.
People who prefer to write code expect a different set of experiences to those that prefer to drag and drop via Graphical User Interface (GUI). And within the group of people who have a preference for using a GUI we will find people who just want to be able to click on a drop down widget to filter the data on a dashboard to get the data task done, and another group of people who want to be able to drag and drop data onto the dashboard themselves. You might name these personas Information Consumers vs Data Analysts, or you might name them Silver Service Information Consumers vs Self Service Information Consumers, or you might name them Information Consumers vs Data Consumers, the key being the complexity of interaction allows us to differentiate groups of people into different personas.
You might have Data Analysts that currently have a strong preference for writing SQL code on a code window, another group that likes writing Python code via a notebook interface and a third group that likes to create the code via drag and drop. So you might create three prefix personas, SQL Data Analysts, Notebook Data Analysts and UI Data Analysts. You might find these three groups are located in different organisational business units, and are hired into that unit if they have those specific technical skills, so you might create three different personas instead, Data Analyst, Research Analyst and Business Analytics Analyst.
The key is making sure there is enough difference in the demographics and/or behaviours of people grouped in one persona compared to another persona to help with conversations across the AgileData teams, stakeholders and consumers. If people start arguing that the personas are the same group of people then that value is missing and so think about combining them.
06 – What style of content do they prefer

Content Delivery
We can use their preferred content delivery style to ensure we deliver the right interfaces, data and information to them.
We can classify the way we deliver content as being one of:
- Dashboard;
- Presentation;
- Summary report;
- List report;
- Pixel perfect report;
- Statistical model;
- Data Service.
<<<Add link to pattern to define these when its written>>>
We can use the format in which we deliver the Information to a group of people to help define the personas.
An Internal Consumer and a Data Analyst will consume information using multiple different content formats, Dashboards, Report etc. Whereas a Data Engineer will just consume data directly via a Data Services (API or direct connection to the data repository).
Data Analysts and Data Engineers can directly access data via the Data Services whereas Internal Consumers can only access information that has been predefined.
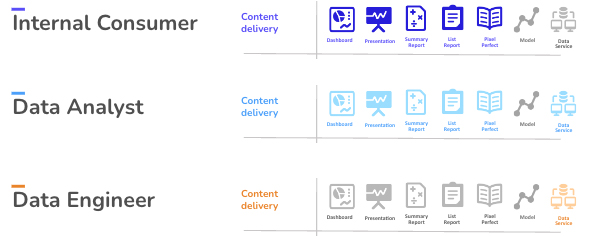
We use the Data Value Stream category colours to highlight the content formats that are used by the persona and grey out the ones which are not.
We can also use the content formats to define the prefix personas.
Senior leaders, Executive Consumer persona, will access summary information, Dashboards, Presentations and Summary reports. Whereas people at the front line, Operational Consumer persona, will use Summary Reports, List Reports and Pixel Perfect Reports.

The focus is on what the persona consumes, not what they produce. Feel free to iterate the canvas and the areas if you find what they produce is a useful way to group people into different personas. Just be sure to clearly define what each area represents and how it is defined.
07 – What type of device to do they prefer to access information
Access device

We can use their preferred access type to ensure we deliver the right interfaces, data and information to them.
We can classify the devices people access data and information as being one of:
- Laptop
- Desktop
- Tablet
- Smart Phone
We can also classify the device interfaces they prefer as one of:
- Command Line Interface (CLI)
- Graphical User Interface (GUI)
<<<Add link to pattern to define these when its written>>>
An Internal Consumer will access information via a Laptop, Tablet or Smart Phone and prefers a GUI interface.
A Data Analyst and a Data Engineer may use a Laptop or Desktop and may have a preference for either a code based interface or a graphical based interface to perform their data tasks.
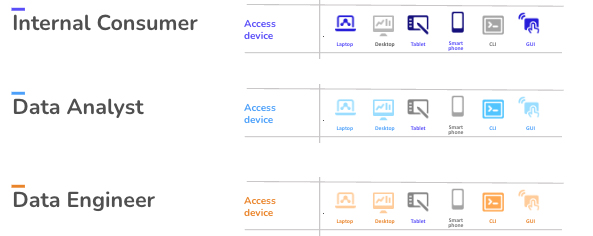
We use the Data Value Stream category colours to highlight the access devices that are used by the persona and grey out the ones which are not.
We can also use the access devices to define the prefix personas.
Senior leaders, Executive Consumer persona, will access via mobile devices, Tablet, Smartphone or Laptop. Whereas people at the front line, Operational Consumer persona, will use a Desktop.
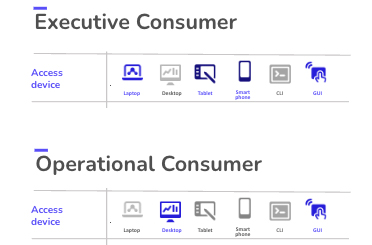
The focus is on what devices the persona uses, not what device they produce information for.
08 – What type of content do they prefer to consume

Content focus
We can use their preferred content focus to ensure we deliver the right interfaces, data and information to them.
We can classify the content types as being one of:
- Operational Insights
- Business Analytics
- Performance Insights
- Advanced Analytics
<<<Add link to pattern to define these when its written>>>
An Internal Consumer will be focussed on consuming Operational Insight and Performance Insight content.
A Data Analyst will be focussed on consuming Operational Insight, Business Analytics and Performance Insight content.
A Data Engineer won’t consume any of these, they are focussed on using data to help deliver them.
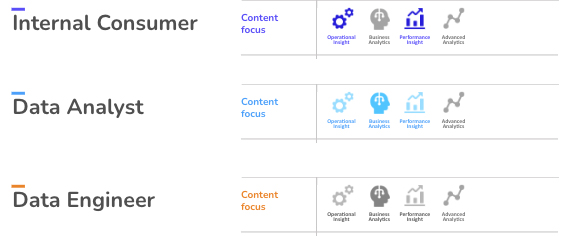
We use the Data Value Stream category colours to highlight the content focus that are used by the persona and grey out the ones which are not.
We can also use the content focus to define the prefix personas.
Senior leaders, Executive Consumer persona, will be focussed on consuming Performance Insight content. Whereas people at the front line, Operational Consumer persona, will will be focussed on consuming Operational Insight content.
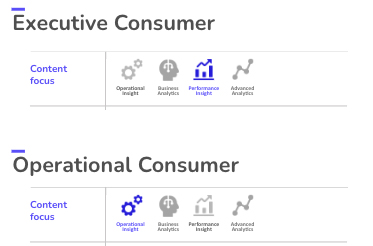
The focus is on what content they are focussed on consuming, it does not mean they won’t have access to the other content types. We are defining these preferences to help us group people into different personas.
09 – What type of data do they prefer to access

Data access
We can use their preferred level of data to ensure we deliver the right interfaces, data and information to them.
We can classify the data access layers as being one of:
- History Data
- Combined data
- Consumable Data
- Predefined Content
- Experimental Data
<<<Add link to pattern to define these when its written>>>
An Internal Consumer will be focussed on accessing predefined content.
A Data Analyst and the Data engineer will both be focussed on accessing data from all levels within the data architecture.
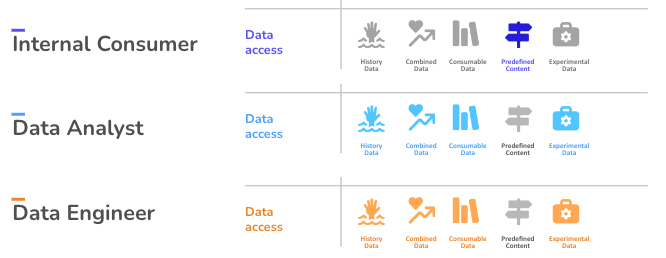
We use the Data Value Stream category colours to highlight the data levels the persona has access to and grey out the ones which they do not.
This example of data access for Consumer, Analyst, Engineer and Data Scientist personas is often contentious. Some organisations will limit the access to the raw history data and the experimental data layers. For example it is common to see Data Analyst personas not being able to access the History Layer.
10 – What actions and outcomes do they care about
Actions and/or Outcomes
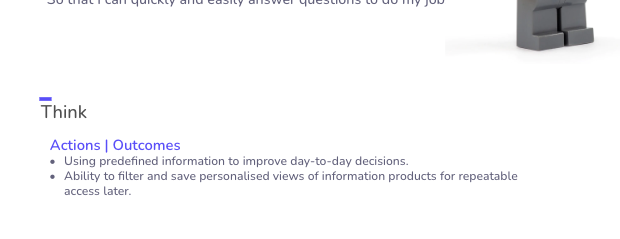
We need to understand the action or outcome that will be undertaken with data, information or tools by the persona.
We are looking to identify the business value that the persona delivers using data, information or the tools. What action will they take if we deliver the right things to this persona and what Outcome is achieved from this action?
We are defining this at the persona level so it is a macro view that is consistent across a group of people. We define detailed actions and outcomes as part of the Information Product Canvas.
Some people struggle to clearly articulate the outcome they achieve using data, information or tools. To assist them in this line of thinking we ask them what Action they typically take on a daily basis, as a result of accessing information.
We often find that the use of Information drives an outcome and the use of tools drives an action. It’s ok to mix many matches in this area, again we are just trying to find demographic or behavioural differences that allow us to group people into different personas, so we can target the delivery of data, information and tools to meet their specific preferences.
An example we might see for an Internal Consumer:
Using predefined information to improve day-to-day decisions.
Ability to filter and save personalised views of information products for repeatable access later.
compared to for a Data Engineer:
Creating reusable data which provides repeatable insights to improve <<<ORG>>> decisions.
One of the things we look for from this area is are they using information to make a decision, perform an action or achieve an outcome themselves, or are they using data to provide data or information to support another person. We can use these to categorise a persona into the Information Consumer, Insight Creator or Data Management stage of the Data Value Stream.
11 – Who do they look like
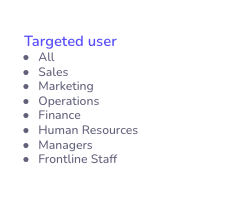
Targeted user
We find that mapping personas to user types or roles within an organisation helps easily identify who fits within the persona group.
Providing relevant examples is a pattern which helps people understand something new because they provide a point of reference for the thing being explained. For example, if someone is trying to explain how big an elephant is, they might say it’s about the size of a small car. This gives the listener a frame of reference for the size of the elephant, making it easier for them to understand and visualise. Additionally, using relative examples can make the information more relatable and memorable for the person consuming it.
We might identify example roles in our organisation which fit this persona, for example a person who has a role of Business Analyst or Financial Analyst might be an example targeted user for the persona of Data Analyst.
We might identify example Business Units as part of the targeted user for the persona. For example we might have a generic Information Consumer persona that includes the majority of people across all the business units, but also have a prefix persona of Executive Consumer that is targeted at members of the Executive Leadership team. This might be because the Executive Leadership team has a preference to access the information via smartphones, while the rest of the Information Consumers in the organisation do not.
12 – What type of data work do they do
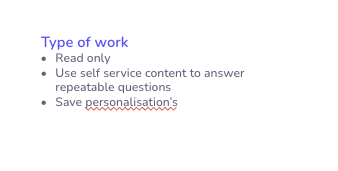
Type of work
We can use the type of data work the personas undertakes to ensure we deliver the features they need to them.
These types of work might include the way the persona uses data and information or the data tasks the personas does to deliver data or information.
An example we might see for an Internal Consumer:
Read only
Use self service content to answer repeatable questions
Save personalisation’s
compared to a Data Engineer:
Write code
Collect and store data
Create experimental data pipelines
Create managed data pipelines
We often find identifying if the personas primarily reads vs creates data and information is a useful way of differentiating personas.
We don’t need to document all the types of data work the personas do, just the ones that are useful to differentiate and compare them to other personas.
